


Track & Graph
คำอธิบายของTrack & Graph
ติดตามและกราฟ: แดชบอร์ดเพื่อชีวิต
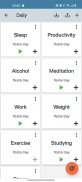
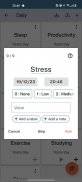
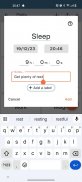
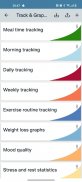
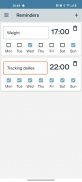
Track & Graph ช่วยให้คุณบันทึก แสดงภาพ และเข้าใจรูปแบบในชีวิตประจำวันของคุณ บันทึกค่าตัวเลขหรือเหตุการณ์ทั่วไปเพื่อสร้างแดชบอร์ดส่วนบุคคลที่ให้ข้อมูลเชิงลึกเกี่ยวกับนิสัย พฤติกรรม และกิจกรรมของคุณ
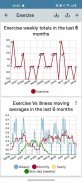
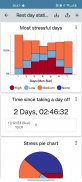
แสดงภาพข้อมูลของคุณผ่านกราฟเส้น แผนภูมิวงกลม และรายงานทางสถิติที่แสดงแนวโน้ม ค่าเฉลี่ยเคลื่อนที่ และช่วงเวลาระหว่างเหตุการณ์ จัดระเบียบรายการติดตามเป็นกลุ่มที่ปรับแต่งได้ซึ่งเหมาะสมกับความต้องการของคุณ
ขณะนี้ Track & Graph ได้ฝัง API สคริปต์ Lua ไว้แล้ว ซึ่งช่วยให้คุณสร้างการคำนวณแบบกำหนดเองได้ (เช่น ผลรวมสะสม ส่วนต่าง หรือตัวชี้วัดทางการเงิน)
Track & Graph นั้นฟรีและเป็นโอเพ่นซอร์สโดยไม่มีโฆษณา บัญชี หรือการซื้อในแอป ข้อมูลของคุณยังคงเป็นส่วนตัว—จัดเก็บไว้ในอุปกรณ์ของคุณเท่านั้น—และสามารถสำรองข้อมูลได้อย่างง่ายดายทุกเมื่อ
Track & Graph--เวอร์ชั่น5.1.3
(19-04-2025)Track & Graph - ข้อมูล APK
เวอร์ชั่น APK: 5.1.3แพ็คเกจ: com.samco.trackandgraphเวอร์ชั่นล่าสุดของTrack & Graph
เวอร์ชั่นอื่น


แอปในประเภทเดียวกัน

คุณอาจจะชอบ...


